Sattelpunkte bestimmen
Bildinfo und Lizenz
© 2016
- 2026
Basiswissen|
Was meint Sattelpunkt hier?|
Hinreichende Bedingung|
Über Ableiten|
Über Dreifachnullstelle
Bildinfo
- Man sieht den Graphen von: f(x)=x³.
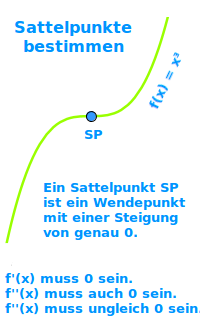
- Ein Sattelpunkt ist ein Wendepunkt mit Steigung 0.
Source
- Created: November 21st, 2019
- Author: Gunter Heim
License
- This image is in the Public Domain.
- You may use it, redistribute and modify it in any way.
- You may but do not need to attribute the author of this image.
Warranty
- No guarantee can be given as to the correctness of facts implied or explicitly stated.
- Usage is completey at your own risk. 💣
Originalseite
- Das Bild ist Teil eines online-Lexikons.
- Rhetos Lernlexikon Mathematik, Aachen:
- Siehe unter 👉 Sattelpunkte bestimmen