Scheitelpunkt aus Normalform über QE
Bildinfo und Lizenz
© 2016
- 2026
Bildinfo
- Man sieht den Graphen von: f(x) = x² - 6x + 13
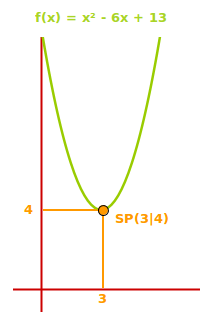
- Man sieht auf der x- und y-Achse jeweils die Koordinaten.
Source
- Created: December 10th, 2019
- Author: Gunter Heim
License
- This image is in the Public Domain.
- You may use it, redistribute and modify it in any way.
- You may but do not need to attribute the author of this image.
Warranty
- No guarantee can be given as to the correctness of facts implied or explicitly stated.
- Usage is completey at your own risk. 💣
Originalseite
- Das Bild ist Teil eines online-Lexikons.
- Rhetos Lernlexikon Mathematik, Aachen:
- Siehe unter 👉 Scheitelpunkt aus Normalform über QE