 Man sieht einen Funktionsgraphen mit der Gleichung:
© Gunter Heim => Zurück zum Artikel
Man sieht einen Funktionsgraphen mit der Gleichung:
© Gunter Heim => Zurück zum Artikel
Quintische Funktion aus Gummibandversuch
Bildinfo und Lizenz
Bildinfo
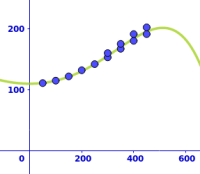
- Man sieht einen Funktionsgraphen mit der Gleichung:
- f(x) = - 2.46153846153838*10^(-12)*x^5 + 3.29448329448237*10^(-10)*x^4 + 2.38383838383875*10^(-7)*x^3 + 0.000469697*x^2 + 0.0001047397*x + 110.0135198135
- Man sieht als Punkte die tatsächlichen Messwerte.
- Die Funktion passt gut für den Messbereich bis 450 Gramm.
- Danach würde die Funktion nicht mehr gut passen.
Source
License
- This image is in the Public Domain.
- You may use it, redistribute and modify it in any way.
- You do not need to attribute the author of this image.
Warranty
- No guarantee can be given as to the correctness of facts implied or explicitly stated.
- Usage is completey at your own risk. 💣
Originalseite
- Das Bild ist Teil eines online-Lexikons.
- Rhetos Lernlexikon Mathematik, Aachen: