Tiefpunkte über Analysis
Bildinfo und Lizenz
© 2016
- 2026
Bildinfo
- Graph der Funktion f(x) = (x-1)³-2(x-1)²
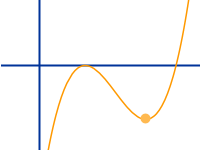
- Kubische Funktion, Graph ist Orange
- Tiefpunkt bei (7/3|-17/9)
- Farbe in RGB-Werten Orange (255,153,0)
- Erstellt mit GeoGebra, Linienstärke 3
- Bearbeitet in Pint (Linux)
- Created: June 2nd 2017
- Author: Gunter Heim
License
- This image is in the Public Domain.
Warranty
- No guarantee can be given as to the correctness of facts.
- Usage is completey at your own risk. 💣
Originalseite
- Das Bild ist Teil eines online-Lexikons.
- Rhetos Lernlexikon Mathematik, Aachen:
- Siehe unter 👉 Tiefpunkte über Analysis