Schule
Bildinfo und Lizenz
© 2016
- 2026
Bildinfo
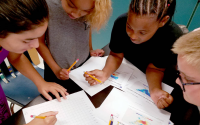
- In einer Schule in den USA: Schüler werten originale Daten von Satelliten aus: wie verändert sich die Wasserressourcen in den USA, welche Trends lassen sich für die Zukunft vorhersagen und welche Schlüsse kann man daraus ziehen?
Source
- Created: Around the year 2019
- Author: Lori Ann Pawlik
- Credit: NASA
License
- This image is from the NASA Imaga Library.
- On the website is the following note:
- NASA content - images, audio, video, and computer files used in the rendition of 3-dimensional models, such as texture maps and polygon data in any format - generally are not copyrighted. You may use this material for educational or informational purposes, including photo collections, textbooks, public exhibits, computer graphical simulations and Internet Web pages. This general permission extends to personal Web pages. [This note was copied from the image gallery site on March 4th, 2020]
Warranty
- No guarantee can be given as to the correctness of facts implied or explicitly stated.
- Usage is completey at your own risk. 💣
Originalseite
- Das Bild ist Teil eines online-Lexikons.
- Rhetos Lernlexikon Mathematik, Aachen:
- Siehe unter 👉 Schule