Gaia-Theorie
Bildinfo und Lizenz
© 2016
- 2026
Basiswissen|
Die Entstehungsgeschichte|
Eine Definition von Gaia|
Leben im Sinne der Theorie|
Gaia hat kein Bewusstsein|
Mathematisierung|
Was sind Solaris-Welten?|
Fußnoten
Bildinfo
- Die Meeresströmungen der Atlantik farblich visualisiert: der Autor James Lovelock sieht in Strömungen einen von mehreren Selbstregulationsprozessen, mit denen die Erde als Ganzes ihrer Umweltbedingungen in engen Grenzen stabil halt. Eine ähnliche Darstellung findet sich auf der deutschen Ausgabe seine Buches: Gaia: Die Erde ist ein Lebewesen. Heyne Verlag. 1991.
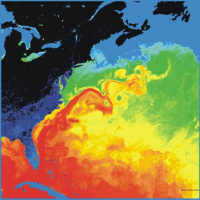
- On May 2, 2001, the Moderate-resolution Imaging Spectroradiometer (MODIS) obtained this spectacular image of the Atlantic Ocean's Gulf Stream. The false colors in the image represent "brightness temperature" observed at the top of the atmosphere. The brightness temperature values represent heat radiation from a combination of the sea surface and overlying moist atmosphere.
- The red pixels in this image show the warmer areas (approaching 25°C), greens are intermediate values (12-13°C), and blues are relatively low values (less than 10°C). Notice the considerable detail in the swirls and gyres of the current patterns in the Gulf Stream.
- This image was produced using MODIS' detectors that are sensitive to the 11-micron wavelength. Brightness temperature is actually a measure of the photons at this wavelength received by the spacecraft, but presented in units of temperature (Celsius). Since the atmospheric water vapor emits photons at this wavelength in addition to those emitted by the underlying sea surface, what you are actually seeing is a combination of both. Thin clouds and water vapor at higher altitudes appear as cooler areas.
- Heat is being released into the overlying atmosphere from the ocean, raising the humidity. This image depicts the complex interaction of the sea with the atmosphere.
- Images courtesy Liam Gumley, MODIS Atmosphere Team, University of Wisconsin-Madison Cooperative Institute for Meteorological Satellite Studies
Source
- This file also exists on: https://visibleearth.nasa.gov/images/1393/gulf-streams-brightness-temperature
- Created: May 2nd, 2001
- Author: Liam Gumley, MODIS Atmosphere Team, University of Wisconsin-Madison
License
Image Use Policy: Most images published in Visible Earth are freely available for re-publication or re-use, including commercial purposes, except for where copyright is indicated. In those cases you must obtain the copyright holder’s permission; we usually provide links to the organization that holds the copyright. We ask that you use the credit statement attached with each image or else credit Visible Earth; the only mandatory credit is NASA.
Warranty
- No guarantee can be given as to the correctness of facts implied or explicitly stated.
- Usage is completey at your own risk. 💣
Originalseite
- Das Bild ist Teil eines online-Lexikons.
- Rhetos Lernlexikon Mathematik, Aachen:
- Siehe unter 👉 Gaia-Theorie