 Man sieht ein Koordinatensystem mit zwei Funktionsgraphen.
© Gunter Heim => Zurück zum Artikel
Man sieht ein Koordinatensystem mit zwei Funktionsgraphen.
© Gunter Heim => Zurück zum Artikel
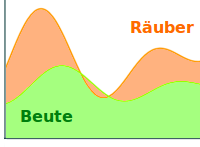
Räuber-Beute-Beziehung
Bildinfo und Lizenz
Bildinfo
- Man sieht ein Koordinatensystem mit zwei Funktionsgraphen.
- Der orangene Graph f(x) steht für die Anzahl an Beutetieren.
- Der grüne Graph g(x) steht für die Anzahl an Räubertieren.
- f(x) = sin(x) + 1 + sin(1.5x - 0.4) + 2
- g(x) = 0.4 (sin(x - 0.8) + 1 + sin(1.5 (x - 0.8) - 0.4) + 4)
- g(x) ist f(x) um zwei nach oben verschoben, mit 0,4 gestaucht, ...
- und 0,6 nach rechts verschoben.
Source
- Created: November 3rd, 2019
License
- This image is in the Public Domain.
- You may use it, redistribute and modify it in any way.
- You may but do not need to attribute the author of this image.
Warranty
- No guarantee can be given as to the correctness of facts implied or explicitly stated.
- Usage is completey at your own risk. 💣
Originalseite
- Das Bild ist Teil eines online-Lexikons.
- Rhetos Lernlexikon Mathematik, Aachen: